SEP 40: Graphs and maps: contextualising with visualisations
A network of nodes/documents can be visualised in different ways in order to provide contextualising overviews and visual entry-points into the graph/tree.
The two primary visualisations that I would like to develop for this site are:
-
A heatmap of the locations documents were created in.
-
A graph/tree view of all documents/nodes in the network/graph
These two visuals are demonstrated using appropriate commons images below. Credit to OpenCelliD for the heatmap (first image) and Martin Grandjean for the graph visualisation (second).


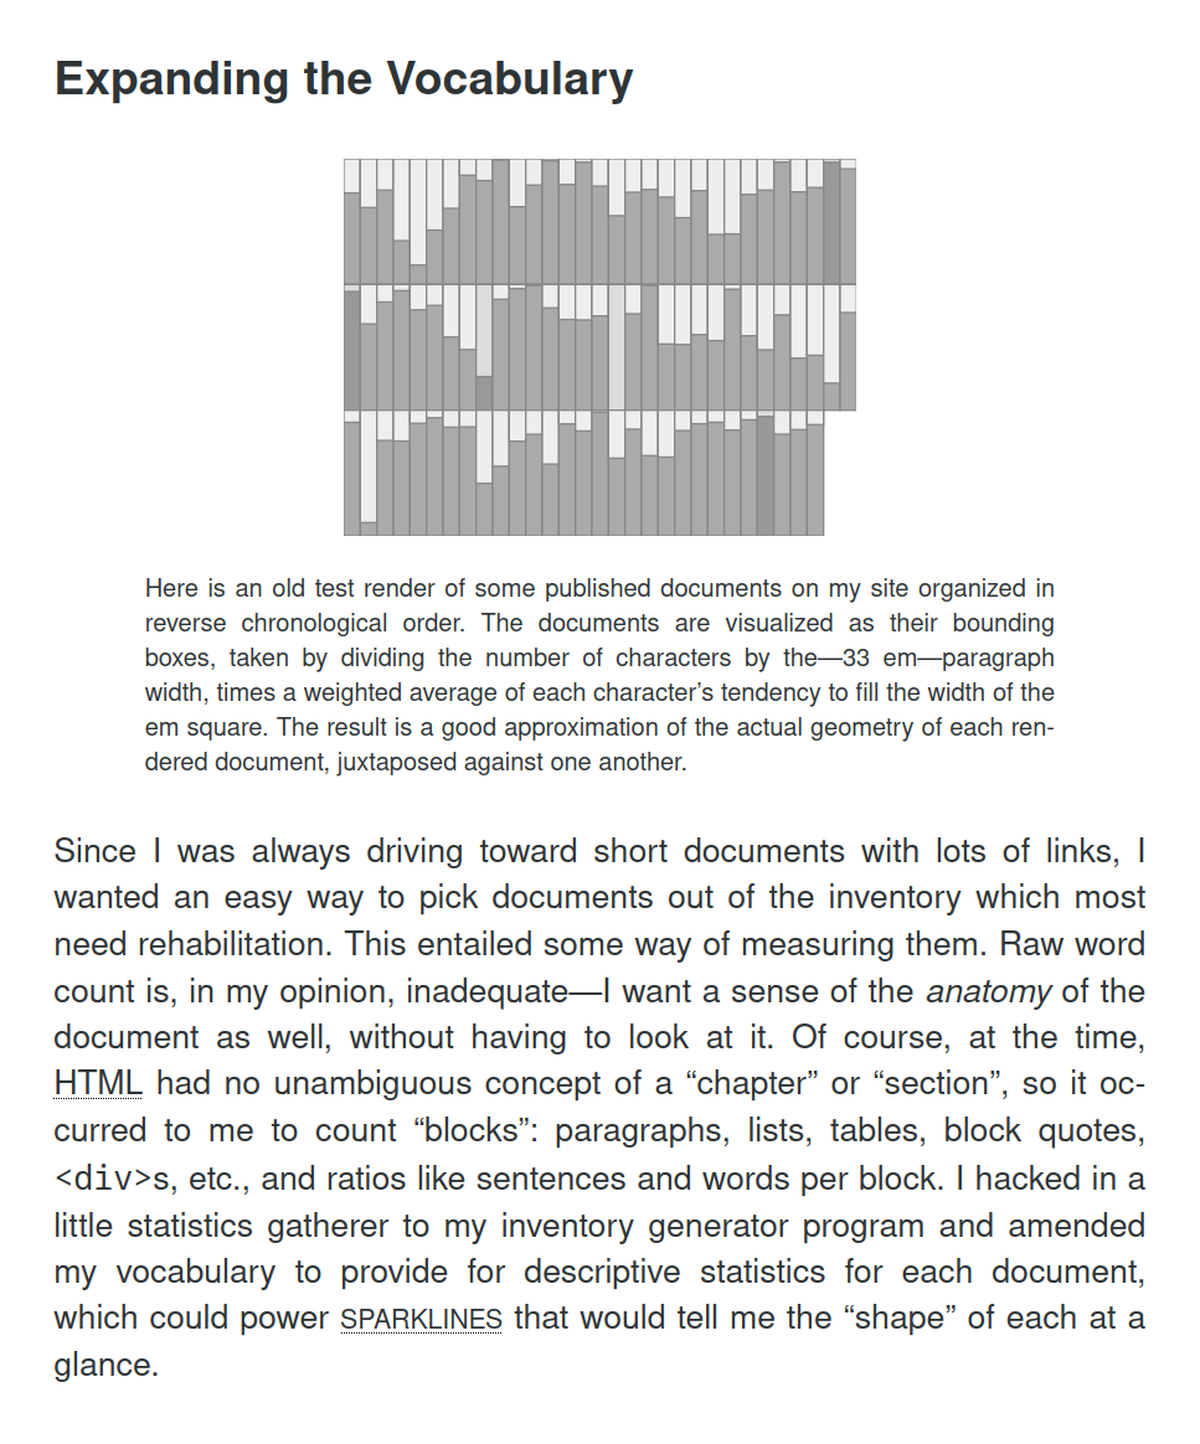
I did find inspiration for another kind of visualisation in Expanding the Vocabulary of Dorian Taylor’s Content Management Meta-System. His sparkline visualisation seeks to approximate the anatomy of a document rather than simply reflecting the word count. In the live version at his site, each segment is a clickable link to the document it represents.